| | |
| | |
| |
| |
| | Growth of Employment in Urban and Rural Areas (1988-98) |
| | 
|
| |
| | Rural non-agricultural sector is the fastest growing sector, growing at a rate higher than the rate of growth of the non-agricultural urban sector. |
| | Regional labor market opportunities |
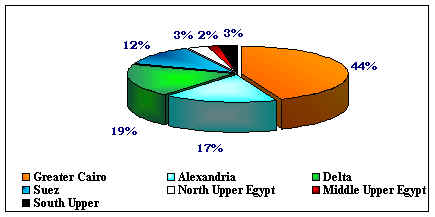
| | Great regional disparities exist in labor market opportunities.Almost half of job opportunities are concentrated around Greater Cairo. The Delta and Alexandria governorates produce another third.The Suez and Sinai region produces 12% of new jobs, while all of Upper Egypt produces less than 10%.
|
| | Regional distribution of available jobs (1999) |
| | 
|
| |
| | |
| | |
| 
|
| Source: CAPMAS, LFSS, 1995-2001 |
| The data of the LFSS 1990-99 show a significant increase in the private sector (outside establishments), which includes farm and non farm activities. Rate of growth is estimated at 22% on average over the period 1990-99.A significant increase happened in the period 1995 – 2001 as the rate of growth reached 144.6%
The Government sector comes at second place after the private agricultural and non agricultural sector and shows an annual rate of growth at 6.88% on average over the period 1990-1999. While during the period 1995 – 2001 , investment sector comes the second with a rate of increase reaching 50% , the government share dropped to the third position as the rate of increase of employment in the government sector increased by 22.9% only during the period 1995 – 2001. (CAPMAS , LFSS 1995–2001)
"Government employment grew at 4.2% per annum, nearly twice as fast as total employment and contributed 38% of the net jobs creation during the period (1990-98)" (Asaad, R. 1999)
All other sectors show a decline in their share in employment over the period under study. The public sector which is an absorber of a large share of employment in Egypt has witnessed a negative increase in employment due to the contraction of this sector. |
| | |
| | |
| 
|
| | Source: CAPMAS, LFSS, 1995-2001 |
| 
| The social services sector continues to be an important and growing source of employment for both men and women. However, the high growth rate in the social services sector, and also in the much smaller electricity, gas, and water sector, reflects to a large extent the government sector's employment guarantee policy rather than real demand for labor. Social services is the only sector in which the rate of growth of new jobs for women is increasing. |
| Manufacturing is another important source of employment, particularly for men, but the rate of employment growth in the manufacturing sector has been slow. The number of new jobs for women in manufacturing has actually been declining. |
| Trade, tourism, finance and insurance are promising areas for employment growth. They are important sources of employment, particularly for men, with relatively high growth patterns. |
| The transport and storage sector experienced some increase in employment, but this sector represents only 6% of total employment. |
| The construction sector, which witnessed a boom in labor absorption in the 1970's, had slower employment growth in employment in the 1990's. For women, the construction sector offers few employment opportunities. |
|
| | |
| | |
| | 
|
| | Source: CAPMAS, LFSS, 1995-2001 |
| |
| The most important source of new jobs for both men and women continues to be in agriculture-related occupations. However, growth in this sector has slowed, and the number of new jobs being created for women has declined dramatically as seen from the previous figure |
| Except for agricultural activities, the government's guaranteed employment scheme continues to be the major source of new employment. Teachers have been the fastest growing component for both women and men, producing more than a third of government employment growth, followed by clerical workers. (Assad, R. 1999) |
| For men, production and transport occupations are almost as important a source of employment growth as agriculture. Sales and service occupations are also important sources of employment for men. There has been relatively little growth in the employment of women in these occupations. (Nassar, H. 2001)
|
|
| | |
| | |
| | The informal sector is estimated at over 40% of total employment, and therefore about 65% of private sector employment (World Bank,2000). The majority of jobs created in the 1988-98 decade were unprotected by a legal employment contract {informal in a sense}. It has been indicated that the rate of growth of contract wage work was slower for females than males. Legal contracts include higher costs for females than for males as they must include paid and unpaid maternity leave. Two sectors are reported to include a large number of informal workers: the tourism industry and personal services. (Asaad, R. 1999). |
| | Growth of the Private Sector Non-Agricultural Wage Work by Protection Status and Sex, 1988-98 | | Male (annual rate of growth) | Female (annual rate of growth) | Total (annual rate of growth) | Protected/Regular | 5.6 | 1.1 | 4.8 | Unprotected/Regular | 7.5 | 3.6 | 7.0 | Irregular (Protected) | 3.5 | -1.4 | 3.3 | Total | 5.9 | 2.3 | 5.5 |
|
| | |
| | Degrees of informality in Employment in Greater Cairo Region |
| | 
|
| | |
| | Full formality for paid and unpaid employment in Greater Cairo Survey applies to individuals who work with contract, and pay social as well as health insurance. If one of the previous items- contract, social insurance or health insurance- is missing, the case is automatically grouped under informal work. Informality in the first grade is the status of working with no contract but with social and health insurance. In the second degree informality is the status of working with contract but with no health or social insurance. Informality in the third degree is the status of working with no contract but with connection to at least an insurance system of any type. Finally, the work status with no contracts, no health, or social insurance is considered totally informal or informal of the fourth degree (Nassar, H .1999).
In total, 50.3% of the paid and unpaid workers and employees have a formal status. The ratio of working females in this status to total working females is higher (66.8%), than the similar ratio for working males (46.1%). The concentration of working females in the Metropolitan area in clerical occupation, in the government may explain this difference.
On the other hand , those who do not have a contract nor health and social insurance were considered informal workers or employees. 49.7% of the workers in paid and unpaid employment (53.8% for males and 33.2% for females) are grouped under this category.
Only 2 % of paid and unpaid workers have a contract and do not have a social or health insurance, with no significant differences by sex. The same applies for those, who have a contract and have some kind of insurance –social or health. A very small percentage of those, who work with no contract have social or health insurance (5.2% of all paid and unpaid workers). Men in this work category were found to be more privileged, as a relatively higher percentage (6.1%) have some kind of insurance, even if they do not have a contract. This ratio goes down to 1.9% for females. (Nassar, H. 1999).
|
| | |
| | |
|
| As the Egyptian population grows, the size of the labor force grows even faster, and is likely to continue to do so in the future. |
| The employment growth rate could reach 3.5% in the coming decade, given the increased participation of women in the work force. |
| As the pool of available labor increases, and labor productivity increases, an increase in the rate of growth of GDP of 6-7% will be required to keep pace with employment growth. |
| Expansion of job opportunities in rural areas will be particularly important, because the rate of growth of the rural labor force continues to outstrip growth of the urban labor force (LFSS, 1990-1998). The rural non-agricultural sector has been the fastest growing sector in the last decade, producing almost twice as many new jobs as the non-agricultural sector in urban areas. |
|
| | |
| | |
| | Unemployment data indicate that unemployment levels are increasing among new entrants to the labor market. The rate of unemployment is highest among those who are 15-30 years old (30% unemployment, compared to an overall level of 8-9% according to official statistics). Almost 95% of the unemployed are new entrants to the labor market. |
| |
| The average duration of unemployment is highest among the youth, reaching 39, 63 and 65 months for the age group 20-25 years , 25-30 years and 30-40 years, respectively. The current profile of the newly unemployed differs significantly from that of the workers who are likely to be displaced in the near future by economic reforms. |
| The relationship between unemployment and educational attainment appears to be negative as the incidence of unemployment is highest among those with intermediate education (70.2 per cent), followed by those in university (18.2%). In 2001 unemployment rate remained the highest among those with intermediate education to reach 65.4 % among males and 72.9 % among females, followed by those having university and higher than university education reaching 24.6% among males and 18.6% among females. |
|
| | Unemployment status by age and gender in Egypt (2001) | Age group |
Male
(Figures in Hundreds) | Male % | Female
(Figures in Hundreds) | Female % | 15- | 1770 | 21.24 | 1812 | 22.82 | 20- | 3706 | 41.91 | 3490 | 37.09 | 25- | 2333 | 29.25 | 2647 | 29.48 | 30- | 648 | 7.08 | 1308 | 10.57 | 40- | 74 | 0.30 | 37 | 0.04 | 50- | 20 | 0.23 | 17 | 0.00 | 60-64 | 0 | 0.00 | 0 | 0.00 | Total | 8551 | 100.00 | 9311 | 100.00 |
|
| | |
| | Unemployment status by educational status and gender in Egypt (2001) | Educational status | Figures in Hundreds | Male % | Figures in Hundreds | Female % | Illiteracy | 85 | 1.00 | 27 | 0.15 | Read & Write | 118 | 1.51 | 93 | 0.26 | Under Intermediate | 166 | 1.93 | 82 | 0.70 | Intermediate | 5595 | 67.23 | 6794 | 73.45 | Upper Intermediate – under Uni. | 493 | 8.69 | 587 | 8.96 | University and above | 2101 | 19.64 | 1734 | 16.49 | Unidentified | 0 | 0.00 | 0 | 0.00 | Total | 8558 | 100.00 | 9317 | 100.00 |
|
| | |
| | Unemployment Rate 1998/99 and 1999/2000 | Years | Labor Force | Workers | Unemployment | Unemployment Rate | 1998/99 | 18310 | 16865 | 1445 | 7.9 | 1999/2000 | 18808 | 17400 | 1408 | 7.5 |
|
| | |
| | |
| | Unemployment rate for individuals (15-64) by Gender (1991-2001) in percentage : | Years | Male | Female | Total | 1991 | 6.6 | 15.6 | 8.9 | 1992 | 6.5 | 17.3 | 9.1 | 1993 | 7.6 | 22.7 | 11.1 | 1994 | 7.5 | 23.1 | 11.1 | 1995 | 7.5 | 24.1 | 11.3 | 1997 | 5.2 | 19.8 | 8.4 | 1998 | 5.1 | 19.9 | 8.2 | 1999 | 5.1 | 19.4 | 8.1 | 2000 | 5.1 | 22.7 | 9.0 | 2001 | 5.6 | 22.6 | 9.2 |
|
| | |
| | |
| Note: There are significant discrepancies in the unemployment estimates from different sources. The overall unemployment rate was 8% in 1999/2000 according to official estimates, while unofficial estimates suggest that it has reached almost 12%. (Asaad, R. 1999; Nassar, H. 1999; Nassar, H. 2001). In 2001/2002 , it reached 9.2 % according to 2001 census. (CAPMAS, Labor Force Survey, 2001) |
| | |
| | |
| |
| |
| | Human capital formation | Indicators | Year | Total | Female | Literacy rate (15+) | 1960 | 25.8 | 12.5 | 2001 | 65.6 | 54.2 | Basic & secondary enrolment ratio (%) | 1960/61 | 42 | 32.1 | 2000/2001 | 86 | 83.0 | Professionals & technicians (as % of labor force 15+) | 2001 | 21.2 | 41.1 | % of people 15+ with secondary or higher education | 2001 | 29.3 | 23.5 | Tertiary graduate ratio (as % of corresponding age) | 1998/99 | 5.5 | 5.2 | 1999/2000 | 5.6 | 5.3 | Science graduates (as % of total graduates) | 1998/99 | 12.9 | 10.3 | 1999/2000 | 13 | 10.5 |
|
| |
| | |
| Challenges to the Education System |
| |
| | How to eradicate illiteracy | | How to install a positive value system and moderate current materialist values | | How to relax the resource constraint to education. | | How to increase public expenditure on education, particularly on investments in educational infrastructure. | | How to enable the poor and low income groups to enroll their children and keep them in school. | | How to improve the training and motivation of teachers. | | How to treat quantity/quality trade off in higher education. | | How to develop curricula in line with employment opportunities for the educated. | | How to increase retention capacity so as to reduce dropout ratio. | | How to bridge gender and regional gaps in education. | | | |
|
| |