Characteristics of the Egyptian Population | |
|
|
Introduction |
| Studying the characteristics of the population and its development over time helps to understand the nature of the society, the degree of mobility and its impact on the country’s development. |
|
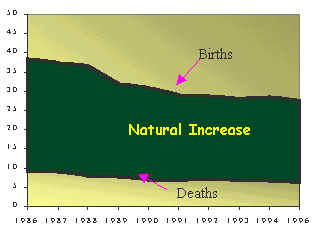
Birth and Death RatesThe crude birth rate is defined as the annual number of births per 1000 population. There has been a change in the crude birth rate in Egypt, where it decreased from 38.6 per thousand in 1986 to 27.6 per thousand in 1996. Then it decreased slightly in 2001 to reach 27.4%. Along the same pattern, the crude death rate is defined as the annual number of deaths per 1000 population. This rate decreased during the period 1986-1996 from 9.2 to 6.2 per thousand population. But it increased slightly in 2001 to reach 6.2%.( Egypt Human Development Report 2003) | | 
|
|
The previous figures are the outcome of the government’s developmental efforts in the population and health fields which resulted in a noticeable decrease in the birth rate and the annual growth rate. During the initial phase of the population policy (1960-1966) the growth rate was 2.52%, but decreased to 2.08% between 1986-1996. |
|
|
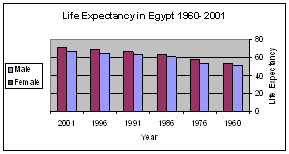
Life Expectancy at BirthThe development of this indicator at the national level reveals substantial progress in the health situation. The data below shows a high increase in life expectancy at birth, which rose from 52.7, 57.7 years among males and females respectively, in 1976 to 65.1, 69 years in 1996. In 2001, it reached 67.1 , 71.5 years for males and females. |
| | |

| | Year | Male | Female | 1960 | 51.6 | 53.8 | 1976 | 52.7 | 57.7 | 1986 | 60.5 | 63.5 | 1991 | 62.8 | 66.4 | 1996 | 65.1 | 69 | 2001 | 67.1 | 71.5 |
|
|